
BLACK DATA LAB
The Black Data Lab is a collaborative Black digital humanities hub that turns Black cultural materials into datasets, visual stories, and public knowledge.
Turning Black cultural and heritage materials into datasets.
The Black Data Lab works in the open. It produces datasets, visualizations, and research projects about Black literature and culture. This page covers what the lab is, what it has made, the field it works in, where its methods come from, and who leads it.
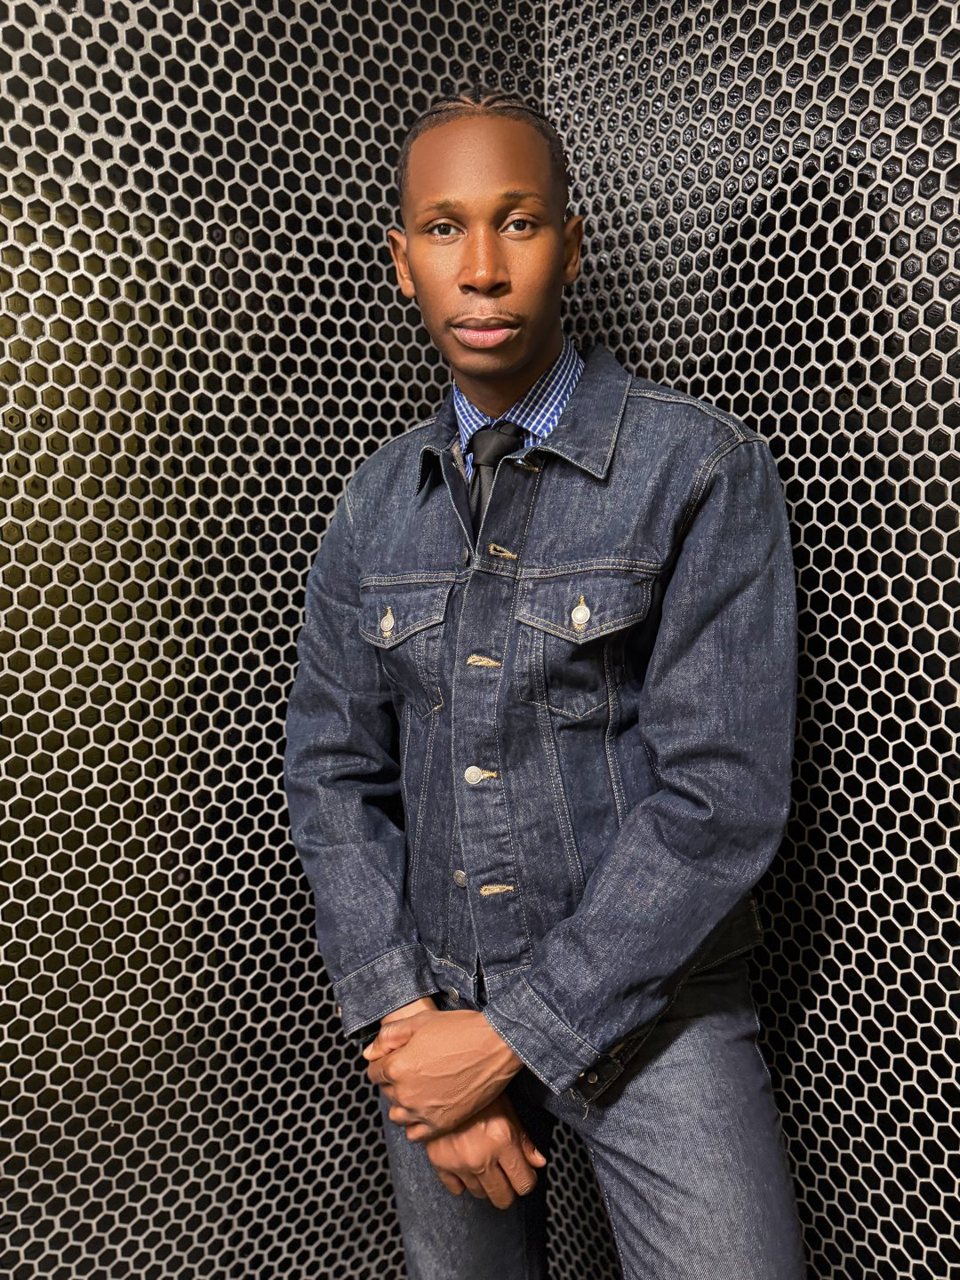
The Black Data Lab builds datasets, visualizations, and research projects about Black literature and culture.
Founded in August 2024 and directed by Dr. Kenton Rambsy at Howard University, the lab is the umbrella that brings his digital humanities projects and collaborations together. It grew out of the Black Lit Network, the Mellon-funded initiative Rambsy co-leads, and it is the outpost he built at Howard to work on individual parts of that network with research assistants and faculty collaborators. It exists to produce work, making cleaned datasets, interactive visualizations, maps, and public research that people can read, search, and build on.
The lab grew out of literary data work, a term Kenton Rambsy and Howard Rambsy II coined for research at the intersection of literary studies, digital humanities, and data science. That work begins with a literary question, gathers the evidence, organizes it for comparison, and develops an interpretation through analysis and visualization. The lab extends these methods to hip hop, Black history, and the changing geography of Washington, DC. Literary research stays the foundation.
Based at a historically Black university, the lab trains student researchers, collaborates with scholars, and consults on projects that use data. It sits within Black digital humanities, a field Kim Gallon named in 2016 and called a technology of recovery. What follows is how that recovery happens, and where it comes from.
Curate. Analyze. Visualize.
The lab does three kinds of work, and each one carries on a Black scholar who did it more than a century ago, before the tools had names. Curating, analyzing, and visualizing are what the lab means by literary data work, and each practice builds a different part of this site.
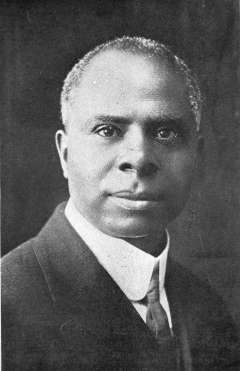
Gather what is scattered into a reference others can build on.
Then. Work spent decades at Tuskegee assembling facts about Black life into the Negro Year Book, a reference where none existed. Now. The lab's special projects gather sources and partners around one question, as in Edward P. Jones and Black Washington, DC, which traces one writer's city across 28 stories.
A sociologist and bibliographer at Tuskegee Institute, where he established the Department of Records and Research in 1908, Work built the first sustained record of Black life in America. His Negro Year Book (1912) and his 1928 Bibliography of the Negro in Africa and America gathered dispersed facts into reference works scholars still cite.
Work treated collecting and organizing Black data as scholarship in its own right, the conviction that grounds the lab's dataset and special-project work.
Monroe Work Today ↗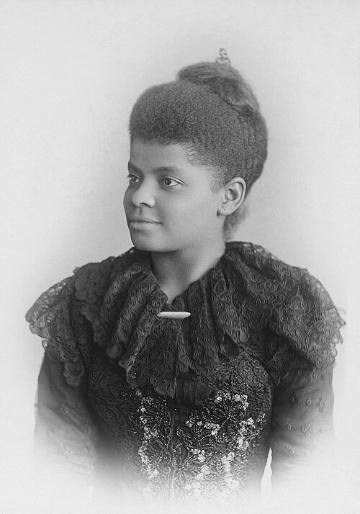
Build the record and let the evidence carry the argument.
Then. Wells compiled her own records of lynching and used the numbers to correct what the newspapers were printing. Now. The lab builds datasets the same way, turning Black literary life into structured records you can test. The Black Short Story Annotation Project holds 300 stories by 71 writers, coded for character, dialogue, and place.
A journalist, educator, and civil rights leader, Wells documented lynching across the American South. In Southern Horrors (1892) and The Red Record (1895) she paired case records with statistics to dismantle the myths used to justify racial violence.
Her insistence that carefully built evidence can overturn a public narrative models what the lab means when it treats data as recovery.
National Women's History Museum ↗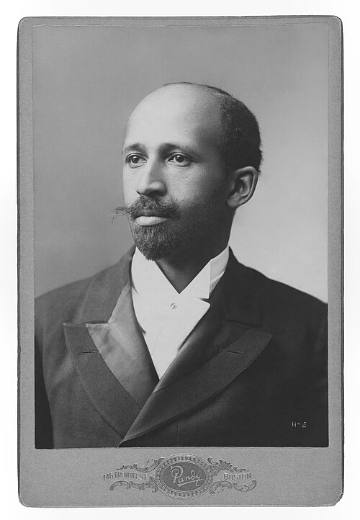
Turn the analysis into pictures people can follow.
Then. Du Bois drew hand-painted data portraits for the 1900 Paris Exposition so audiences could see Black life at a glance. Now. The lab turns its datasets into dashboards and data stories, so a finding never stays locked in a spreadsheet.
A sociologist, historian, and civil rights leader, Du Bois co-founded the NAACP and reshaped the study of Black life. For the 1900 Paris Exposition, his Atlanta University team produced striking hand-drawn charts of Black American progress.
Those data portraits, made decades before the field had a name, are a touchstone for Black digital humanities and the lab's visualization work.
NMAAHC on Du Bois at Paris, 1900 ↗Together, these three practices are how the lab turns Black cultural and heritage materials into work that others can read, search, and build on.
The work, by the numbers.
The lab measures itself by what it produces. These figures read straight from the site and climb each term as new datasets, projects, and visualizations go live.
Where the lab works.
Two research domains and one service anchor the lab's work. Hover a card for what each one covers, then open the datasets and special projects that come out of them.
Black Literary Data
Datasets drawn from Black fiction, anthologies, and the circulation of Black writers.
The anthology dataset tracks 1,878 authors across 51 anthologies, and the annotation project codes 300 short stories for character, dialogue, and place.
See the datasets ▸Washington, DC Data
Census, health, and neighborhood records that turn the city into a working archive.
The Edward P. Jones project maps 28 stories against DC census and neighborhood change, and the cancer stories track health disparities across the city.
See the special projects ▸Consulting and Collaboration
The lab also works on projects that other people lead.
We help partners collect, organize, analyze, and present their data, and we help frame the questions before a technical specialist joins.
Contact the lab ↗The lab gathers all of this under a single field, one that reads more clearly when it sits beside the two fields it grew out of.
Three fields, one purpose.
The lab works in Black digital humanities, the field that shapes every dataset, map, and visualization it makes. The name reads more clearly beside the two fields it grew out of, so hover a card to see how the lab uses each. Its roots run deeper still, in the lineage of Black scholars shown above, who were doing this work a century ago.
Studies data itself. It asks how data behaves and what it can predict.
We use data science methods to clean, structure, and analyze our datasets. Data science interns train in the lab alongside literary researchers.
Brings computational tools into literature and history, and keeps the field itself first.
Our datasets, maps, dashboards, and data stories place the work in digital humanities. The Edward P. Jones project maps 28 of his stories against census and neighborhood data.
Adds a reason to those tools. It makes Black life the subject, a technology of recovery Kim Gallon named in 2016.
Recovery drives the work. The Black Short Story Annotation Project has coded 300 stories by 71 writers so Black short fiction can be studied at scale, a record that did not exist before.
Data science masters the tool, digital humanities masters the method, and Black digital humanities adds the purpose. For this lab, that purpose is recovery.
Dr. Kenton Rambsy
Kenton Rambsy is the founder and director of the Black Data Lab and an Associate Professor of African American literature at Howard University, where he also serves as a data storytelling and visualization specialist with the Center for Applied Data Science and Analytics (CADSA). He earned his doctorate at the University of Kansas in 2015, and his approach took shape there through the History of Black Writing and the Black Book Interactive Project, which drew him toward the metadata needed to study Black literature computationally.
Data is central to his scholarship. The Geographies of African American Short Fiction (2022) uses literary datasets to show how editorial selection shapes which Black writers readers encounter, and his latest book, One Black Writer at a Time (2026), co-authored with Howard Rambsy II, draws on a dataset of 1,000 Black writers to trace how newspapers, anthologies, and scholarly publishing distribute attention unevenly. He is Co-PI of the Mellon-funded Black Literature Network and co-founded the Literary Data Gallery. Through the lab, his commitments to literary research, collaborative data work, and student training have an institutional home at Howard.



Meet the team.
Hover over a profile or select a node to read more about the Black Data Lab affiliates. Filter by role or project below.
Projects and collaborations.
Special projects are the lab's larger efforts and its work with partners. Each one gathers people and evidence around a shared question. Hover a card for the overview, then open it to read the full description, the collaborators, and the current status.
Records built for reuse.
These datasets gather Black literary and cultural records that the lab has located, cleaned, and organized. Hover a card for a quick read, then open it for a documentation page with the dataset's parameters and how to request it.
Dashboards and data stories.
Each visualization turns one of the lab's datasets into something you can read and explore. Hover a card to see the insight it carries, then open the live dashboard right here on the page.